5 Essential Tips for Creating Engaging Data Visualizations
Creating engaging data visualizations is crucial for effectively communicating complex information. Here are 5 essential tips to elevate your visual storytelling:
- Know Your Audience: Tailor your visuals to the needs and understanding of your target audience. Consider their level of expertise and what insights they seek from the data.
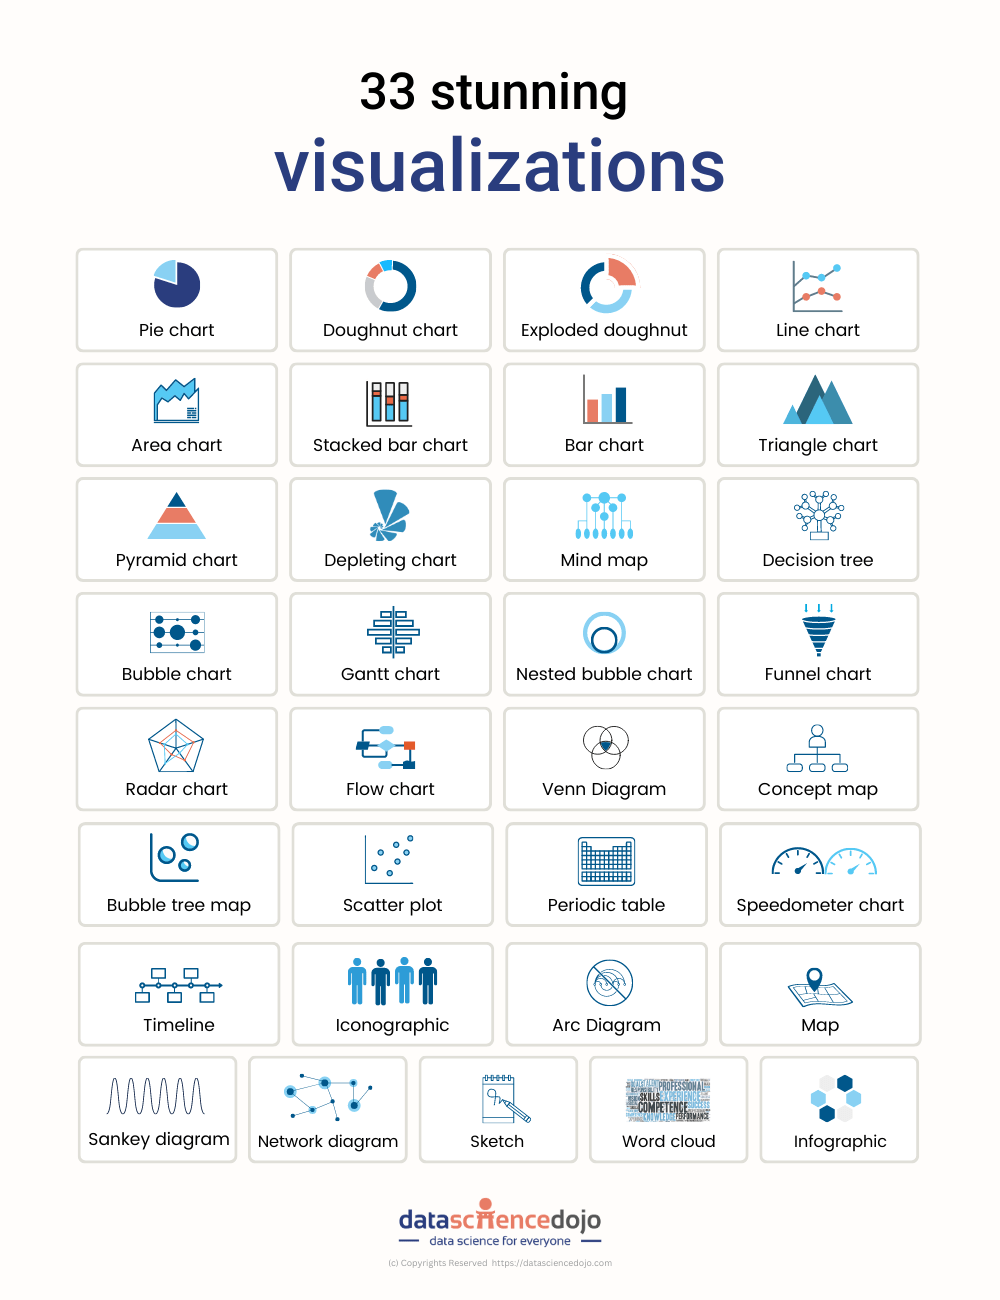
- Choose the Right Type of Visualization: Different data types call for different visualization methods. Use bar charts for comparisons, line graphs for trends, and pie charts for parts of a whole, ensuring they enhance clarity rather than confuse.
Furthermore, aesthetics play a significant role in engagement. Tip number three emphasizes the importance of incorporating colors and fonts that align with your brand while remaining visually appealing. Tip four is about simplifying your design; avoid clutter and focus on key data points to maintain viewer interest. Finally, tip five suggests adding interactive elements, allowing users to explore the data for a more immersive experience.
The Power of Color: How to Enhance Your Data Storytelling
The power of color in data storytelling cannot be underestimated, as it plays a critical role in guiding the audience's perception and understanding of your information. By choosing a well-thought-out color palette, you can create visual hierarchies that draw attention to the most important aspects of your data. For example, using contrasting colors for different data sets allows viewers to quickly distinguish between them, enhancing clarity and engagement. Additionally, incorporating color psychologically can evoke emotions; warm colors may encourage excitement and urgency, while cool shades promote calmness and reliability.
Furthermore, effective use of color can significantly improve the overall aesthetic of your data visualizations, making them more appealing and memorable. To maximize the impact of color in your presentations, consider following these guidelines:
- Select a limited color palette to avoid overwhelming your audience.
- Use color consistently across visuals to reinforce branding.
- Ensure that colors are accessible, taking into account color blindness and other visual impairments.
What Makes a Data Visualization Effective? Key Elements to Consider
Data visualization is a powerful tool that helps to convey complex information in a clear and engaging manner. Effective data visualizations share several key elements, including clarity, accuracy, and engagement. Clarity is paramount; the visual should immediately communicate the main trends or insights without overwhelming the viewer with unnecessary details. Consider utilizing colors and shapes judiciously to direct the viewer's attention to the most salient features of the data. Additionally, accuracy is crucial; misleading visual representations can distort interpretations and lead to poor decision-making. As a best practice, always ensure that the data is correctly represented, and include appropriate scales and labels.
Another essential element of effective data visualization is context. Providing background information and clear explanations of what the data represents can immensely enhance understanding. This can be achieved through annotations or tooltips that explain particular data points. Furthermore, interactivity can elevate the user experience by allowing viewers to engage with the data, explore different dimensions, and gain deeper insights. Ultimately, a combination of these elements—clarity, accuracy, context, and interactivity—will lead to more effective data visualizations that not only inform but also inspire action.